
2D and 3D Waterfall Displays
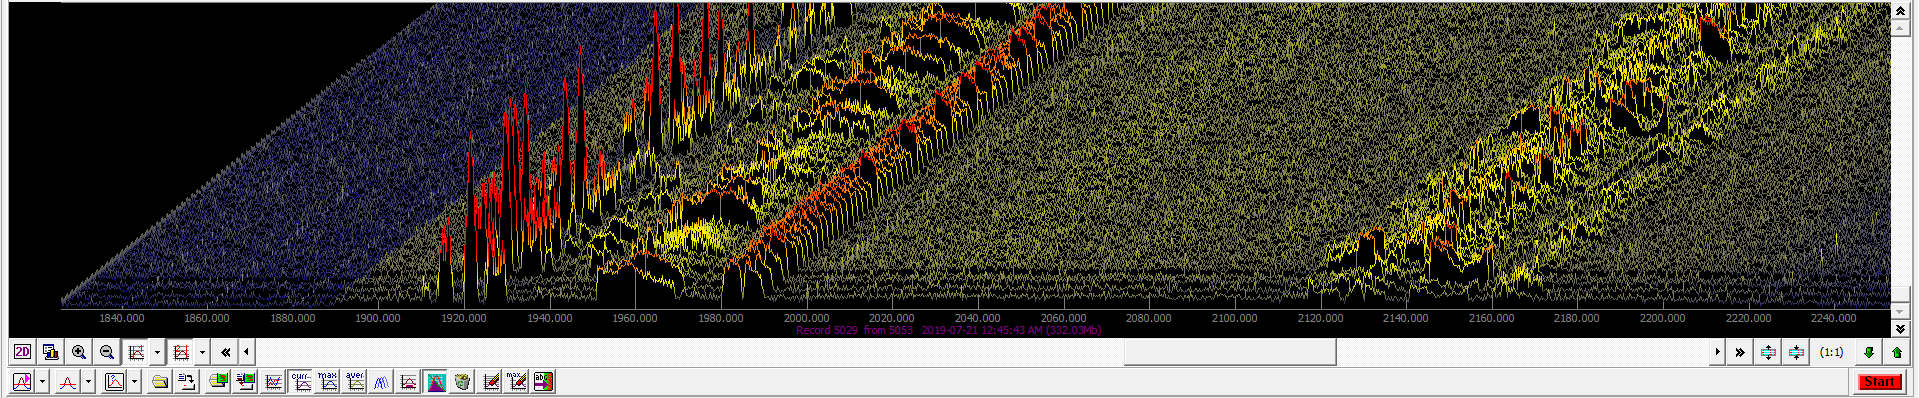
RadioInspector provides a 2D and dynamic scalable 3D waterfall display, both of which are automatically written to the integrity protected database during the scanning and data collection process. The 2D waterfall is frequency, time and date stamped while the 3D waterfall provides a unique 3-dimensional visual analysis tool that can be adjusted on the X and Y axis. Both 2D and 3D waterfall displays can be replayed forward and backward at user selected speeds and are available during spectrum scanning, fixed frequency inspections, when using the RF signal analysis and performance measurement system as well as during post analysis.
Dynamic Compression and Increased Resolution
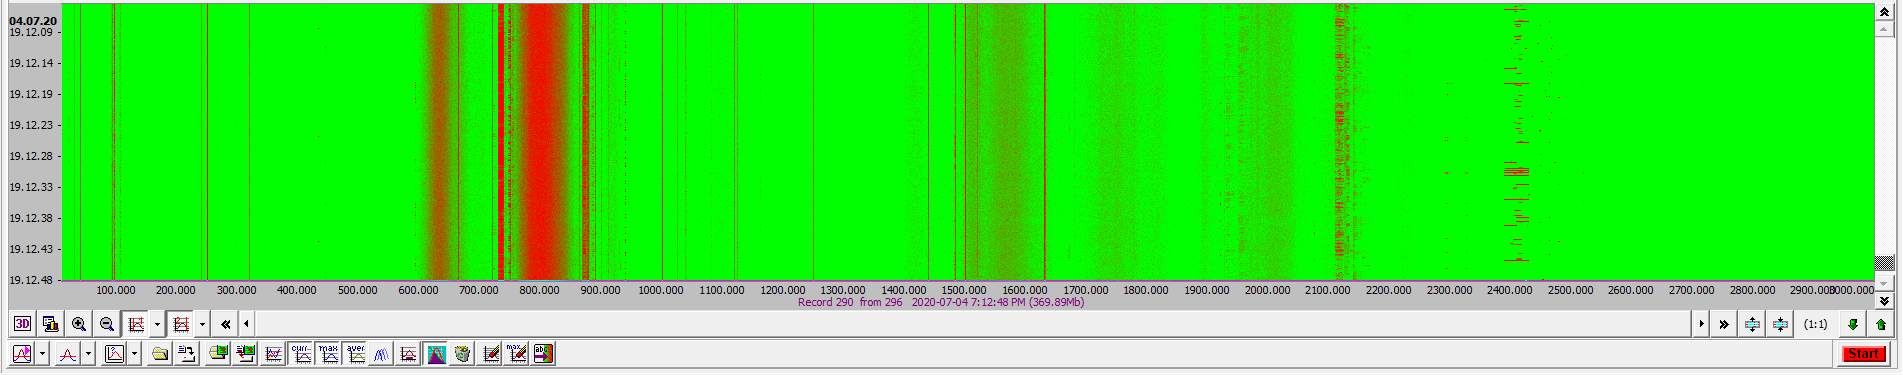
During live spectrum scanning, the 2D waterfall display resolution can be increased up to a 10:1 ratio, providing accurate analysis of time increments. Resolution can also be increased or decreased to a 1:1 ratio in operator selected increments at any time, on the fly, without stopping the RF collection process.
The RadioInspector RP (post processing) program provides “dynamic compression and decompression” of all saved measurement results for waterfall displays. This effectively compresses time of measurement into a single view for both 2D and 3D waterfalls, that can be expanded and contracted at anytime during post analysis in operator selected predefined step sizes to a ratio of 1:4096. The 2D waterfall retains all frequency, time and date stamps at any compression level, and clicking any point on the waterfall takes you directly to the specific moment in the recorded spectrum trace as well as to the associated database file which shows the date, time, maximum level, and the longitude, latitude, altitude and speed at the time of measurement (if a GPS receiver was used during data collection). The 2D waterfall resolution can also be increased to a 10:1 ratio at operator selected increments during post processing.
Dynamic compression and decompression of waterfall displays is available to the operator for all saved spectrum scan files automatically during post analysis, and requires no setting changes or selections during data collection.
Using these advanced TSCM tools, complex technical emissions such as burst transmitters, frequency hoppers and ultra-wide band signals can be detected and analyzed over long periods of recorded data during live or 24 X 7 remote spectrum monitoring.