Geographic Information Support System

Open Street Maps (OSM)
RadioInspector’s Geographic Information Support System utilizes built in Open Street Maps which is free to use and accessible immediately from within the RadioInspector GUI. Once an area has been selected the maps are automatically cached, available for use in the field and do not require an internet connection during live data collection or post-analysis. Operators using MapInfo can select the MapInfo Geographic Information System for added flexibility depending on individual requirements.

* When using a tablet computer during data collection and direction finding applications, RadioInspector also includes an option to increase the size of the geographic information system feature buttons, for improved visual identification and use.

Global Positioning System (GPS) Support
From the measuring set up window, operators can select the COM port for use with a GPS receiver and the baud rate. A visual representation of satellite positions is provided with accuracy data and current local as well as Greenwich date and time. A table shows which satellites are in use and a separate tab provides GPS NMEA data. Current coordinates are also shown along with altitude, velocity (if mobile) and azimuth measurements.

In Place Data Collection or Mobile Tracking
From the main spectrum scanning and analysis GUI the current data collection point can be shown with the associated coordinates. During mobile monitoring or drive-by testing applications the traveled route can be displayed live on the map interface showing individual measurement points. Icons above the map display, provide access to a variety of additional functions including increasing or decreasing the map scale, calculating distances from selected target points, displaying amplitude bearing results, displaying transmitters from the authorized frequency database and selecting a measuring area within the map to be saved as a new file. Maps can also be printed and saved as a BMP file for reporting.


Database Support (Advanced Database Option)
When displaying transmitters from the authorized frequency database directly onto the map, all transmitters in the database can be shown, or they can be filtered to show only those within the current frequency scanning range. Clicking on a transmitter displays associated measured or programmed data and all fields can be edited at any time. Operators can create any number of authorized databases which can include signals detected and recorded during spectrum scanning or programmed from available regional or international frequency databases.

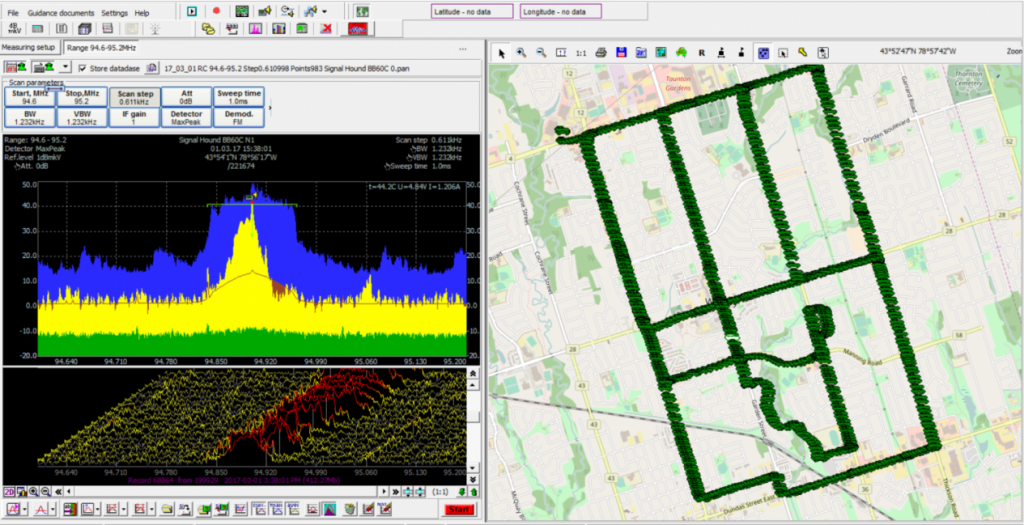
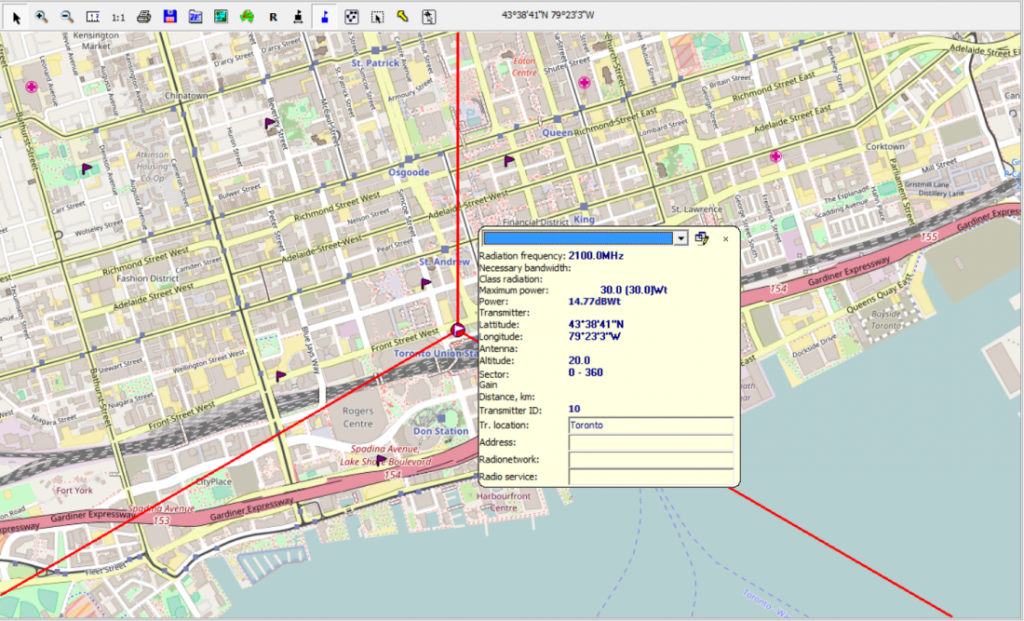
All geographic information system data is automatically saved and dynamically linked with spectrum data during the collection process and is available for post-processing. All measurement parameters are related within the database supporting greater situational analysis capability for determining communication path quality and coverage areas or searching for interference sources and detecting unauthorized transmitters. All icon buttons and features available during data collection are available during post-analysis along with the option to display the map in a separate floating window.

Post Analysis with RadioInspector RP
During post-analysis each measurement point can be color-coded based on up to 15 different operators determined thresholds for visual presentation on the map. Operators can also filter the visual display by removing selected threshold levels or merging measurement points within operator selected distances in meters, with results displayed by the median, average, minimum or maximum values.

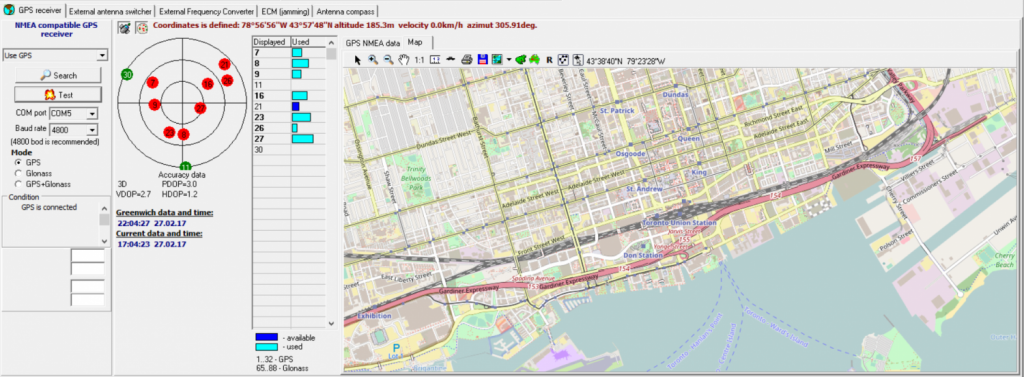
Data collected can be displayed for each measurement point directly on the map as well as in the common data table and includes date and time, maximum signal level dB, longitude, latitude, altitude (meters), speed (km/h) and compass bearing information.

Specialized Countermeasures and Intelligence Solutions

Contact Us

(416) 414-7231

Mailing Address

5979 Baldwin St. S P.O. Box 30022 Whitby, Ontario Canada L1M 0B5